Iain Schmitt
A Wasted Weekend on Kafka
Back when I was at SPS, I spun up a single-broker cluster on my DigitalOcean VPS to get a better handle on Apache Kafka. As I wrote in Kafka in One File, I originally wanted to run Kafka out of my homelab DMZ VLAN in a way that was still accessible from the wider internet with mTLS authentication. It is a bad idea to have internet-accessible Kafka for true production infrastructure, but while working on the Bear Territory stock exchange model, I wanted Kafka access even if I wasn't in my home network.
Unfortunately, I could never get the reverse proxies to work, so as a temporary measure I ran Kafka directly on my VPS with its measly single gigabyte of RAM. It worked fine last year for Bear Territory, and given that I had gone to the trouble of setting up a cluster, I decided to start writing my Nginx logs to a new topic. Admittedly, most of the traffic to my public-facing domains is from bots (some benign, others not), but I still wanted to know what traffic I was getting on which posts.
However, there is an obvious problem with running Kafka on such a memory-constrained server. Multiple times a month, Kafka would take down my new-york-0 VPS, and this is what I would see in Grafana:
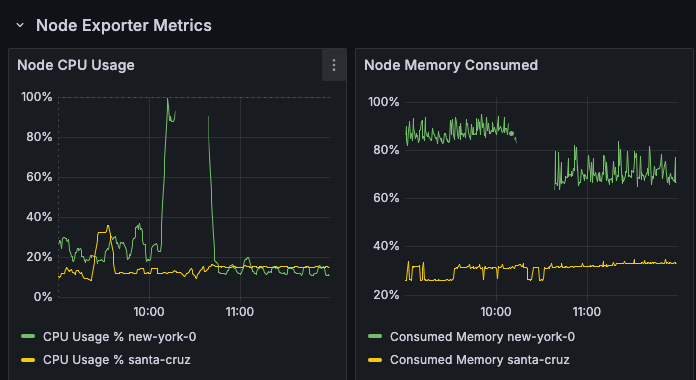
Traffic on this broker wasn't crazy, with maybe 10 records per second at an average size of ~850 bytes. In these incidents, Kafka would be spending essentially all of the server's user CPU cycles on garbage collection, but outside of that it isn't entirely clear to me what is happening here: I'd have to re-read the internals chapter of the O'Reilly Kafka Book to jog my memory, but my best guess is that this would happen when older segments were compressed and written to disk. At some point, I should try to recreate this on a virtual machine and grab some JFR recordings to know for sure, but the gap in the new-york-0 metrics shows that the VPS was so CPU-constrained that it couldn't serve Prometheus metrics, let alone anything else I run on that server, which includes this website.
When my wife was away at a bachelorette party in early August, I had an opportunity to spend a lot of time migrating the cluster to my homelab. Nothing from the internet goes to my homelab without first going through a VPS, and this would be no exception. What complicated this is that I wanted the VPS itself to access the cluster, because that is where the producer for my Nginx log topic lives.
The network configuration is convoluted, but I eventually got this to work. Kafka clients, both inside and outside the VPS, refer to the cluster with broker-0.santa-cruz-kafka-1.iainschmitt.com:10000 and broker-1.santa-cruz-kafka-1.iainschmitt.com:10001. Following along with the table below, these DNS A records resolve to my VPS, and those same records resolve to my homelab IP on the VPS using /etc/hosts.
| Host | broker-0 resolves to |
broker-1 resolves to |
Commentary |
|---|---|---|---|
| Public DNS | 161.35.106.161 |
161.35.106.161 |
VPS's public IP, different ports for different brokers |
VPS /etc/hosts |
198.51.100.251 |
198.51.100.25 |
Homelab WAN IP |
| santa-cruz (broker-0 host) | 192.168.6.14 |
192.168.6.17 |
DMZ LAN IP |
| san-diego (broker-1 host) | 192.168.6.14 |
192.168.6.17 |
DMZ LAN IP |
DNS is only part of the picture, because the traffic needs to go from the VPS to the two brokers in my homelab. The first hop is taken care of by port-forwarding rules that direct all VPS traffic on ports 10000 and 10001 to my homelab WAN IP:
$ sudo firewall-cmd --zone=public --list-forward-ports
port=10000:proto=tcp:toport=10000:toaddr=198.51.100.25
port=10001:proto=tcp:toport=10001:toaddr=198.51.100.25
My homelab IP is assigned to my pfSense router, so one more set of port-forwarding rules is needed. Requests to port 10000 are forwarded to port 9093 for the host with the first broker, with port 10001 requests forwarded to the same destination port on the second broker's host:
$ sudo pfctl -s nat | grep 9093
rdr on mvneta0 inet proto tcp from <PublicReverseProxies> to 198.51.100.25 port = 10000 -> 192.168.6.14 port 9093
rdr on mvneta0 inet proto tcp from <PublicReverseProxies> to 198.51.100.25 port = 10001 -> 192.168.6.17 port 9093
Each broker is a Podman container running Kafka; below is a part of the docker-compose.yml file for the first broker, on 192.168.6.14.2 The KAFKA_LISTENERS line lists all the URIs the broker will listen on, and is pretty normal with the exception that port 9093 uses SSL. KAFKA_ADVERTISED_LISTENERS lists the URIs that Kafka will advertise to other clients and brokers: if a request comes from a URI that isn't on this list, the broker will ignore it. The 192.168.6.14:9092 and 192.168.6.14:9095 are only ever used by the second broker at 192.168.6.17; it would be silly to route inter-broker traffic through the entire internet, so, as implied by those addresses, this traffic doesn't leave the DMZ. But note that the advertised URI for clients is broker-0.santa-cruz-kafka-1.iainschmitt.com on port 10000 rather than 9093. Original requests from clients, both on the VPS and elsewhere, use broker-0.santa-cruz-kafka-1.iainschmitt.com:10000 and broker-1.santa-cruz-kafka-1.iainschmitt.com:10001, and those original URIs need to match an advertised listener address rather than a *:9093 URI used internally in the port-forwarding chain.
services:
  kafka:
    image: docker.io/confluentinc/cp-kafka:8.2.2
    container_name: kafka-broker-0
    ports:
      - "9092:9092"
      - "9093:9093"
      - "9094:9094"
      - "9095:9095"
    environment:
      KAFKA_NODE_ID: 0
      KAFKA_PROCESS_ROLES: 'broker,controller'
      KAFKA_CONTROLLER_QUORUM_VOTERS: '0@192.168.6.14:9094,1@192.168.6.17:9094'
      KAFKA_CONTROLLER_LISTENER_NAMES: 'CONTROLLER'
      KAFKA_LISTENERS: 'PLAINTEXT://0.0.0.0:9092,SSL://0.0.0.0:9093,CONTROLLER://0.0.0.0:9094,REPLICATION://0.0.0.0:9095'
      KAFKA_ADVERTISED_LISTENERS: 'PLAINTEXT://192.168.6.14:9092,SSL://broker-0.santa-cruz-kafka-1.iainschmitt.com:10000,REPLICATION://192.168.6.14:9095'
      KAFKA_LISTENER_SECURITY_PROTOCOL_MAP: 'PLAINTEXT:PLAINTEXT,SSL:SSL,CONTROLLER:PLAINTEXT,REPLICATION:SSL'
This took an embarrassing amount of time to get working, so much so that I would have done something else that weekend (computing or otherwise) if I had known what a hassle it would be. Here are just some of the issues I ran into:
- Before
/etc/hostswas updated on the VPS, clients on that server would not work because thePREROUTINGchain rules aren't applied to packets coming from the VPS. So hostname resolution fell through to public DNS, and it tried to connect to itself on ports 10000 and 10001 where nothing was listening. This didn't apply to clients outside the VPS. - When VPS IP
161.35.106.161was used in place ofbroker-X.santa-cruz-kafka-1.iainschmitt.cominKAFKA_ADVERTISED_LISTENERS, clients on the VPS didn't work because this bypassed the/etc/hostsfix and reintroduced a hairpin. - When I misspelled
security.protocolasecurity.protocolin theapplication.propertiesfile used bykafka-topics.shwhile troubleshooting, the program failed with anOutOfMemoryErrorrather than with an exception that actually pointed out what was going on.3 - The JVM DNS cache persisted across successive calls to
kafka-topics.sh, which was a particular pain while troubleshooting. It is not fun to have Kafka command-line tools anddigresolve hosts differently.
This was something of a 'play stupid games, win stupid prizes' because the network requirements are a little bespoke. My job hunt earlier this year put Puro development into something of a hiatus, but an embedded event stream would be better suited to my needs than a technology designed to broker over 100,000 events per second.
-
I used an RFC 5737 IP address in lieu of my actual IP address for reasons obvious enough not to explain.↩︎
-
The second broker at
192.168.6.17had an equivalent compose file.container_nameandKAFKA_NODE_IDwerekafka-broker-1and1respectively.KAFKA_ADVERTISED_LISTENERSURIs used192.168.6.17:909xandbroker-1.santa-cruz-kafka-1.iainschmitt.com:10001.↩︎ -
Sonnet 5's commentary on this was the following: "the client fell back to plaintext, tried to read the broker's TLS handshake bytes as if they were a Kafka protocol frame, misread the first few bytes as an enormous frame-length field, and attempted to allocate a buffer sized to that garbage number."↩︎